Get an Accurate Picture of that Storm

Krista Melnar
Stormwater Engineer
Anywhere in the United States decision-makers can get an accurate picture of how much rain fell and where thanks to a new tool.
 Using Freese and Nichols Research and Development funding, our team developed the Rainfall Wrangler, which automatically analyzes gauge-adjusted radar rainfall over a specific area and timeframe and creates summary spreadsheets and maps.
Stormwater Engineer Garrett Johnston, PE, CFM, GISP, and GIS Analyst Dan Lindner created the tool, which can analyze an area as small as a town or as large as a state.
Decision-makers have typically relied on rain gauges to understand historical rainfall. These provide detailed information about precipitation at certain points, but this data can be supplemented using radar rainfall data between gauges. Other questions may linger, such as: How was the rainfall distributed over time and space? How rare was the storm, and how does it compare to infrastructure design criteria? The tool can answer those questions and help clients understand how their infrastructure performed.
The tool can supplement traditional rain gauge data to give a more accurate picture of how rainfall is spatially distributed – especially in more rural areas where gauges may be few and far between.
How Does It Work?
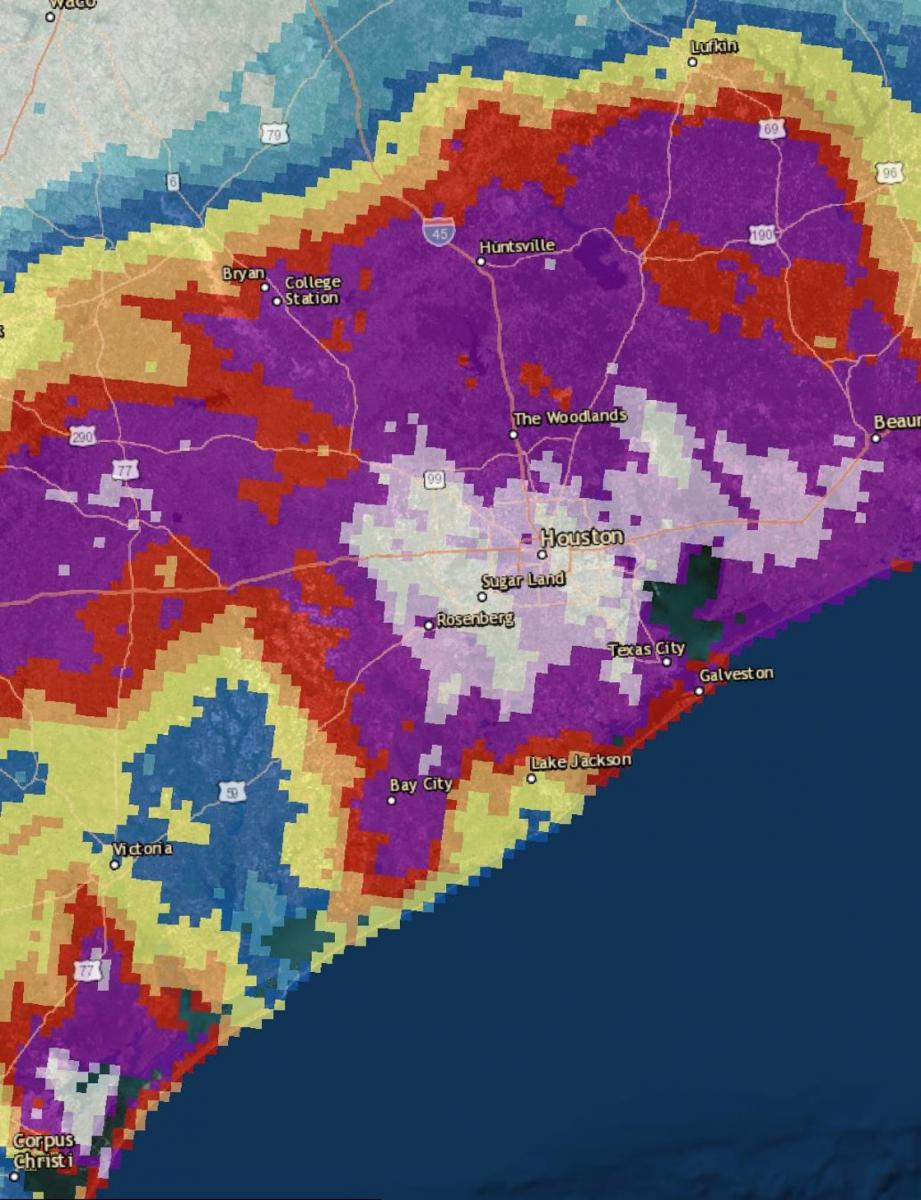
The tool starts by obtaining rainfall estimates from the National Weather Service (NWS). These estimates are produced hourly by each of the NWS’s 13 River Forecast Centers using radar and rain gauge data. The estimates are combined into a single product covering the entire United States and quality-controlled by the NWS. Next, the tool compares the highest rainfall depths over durations ranging from 1 hour to 30 days with the corresponding Atlas 14 precipitation frequency curves. These curves provide statistical rainfall depths at any given location for a range of storm probabilities, such as the 1% annual-exceedance-probability (AEP) or “100-year” storm event. The tool then produces a color-coded map depicting the approximate return intervals in the region of interest and a summary spreadsheet that can plot the rainfall distribution and Atlas 14 depth-duration-frequency curves for any given location in the region.
 The tool cuts down an hours-long manual effort of GIS analysis into a 2 to 5 minute process, depending on the size of the region of interest.
Expanding the Tool Further
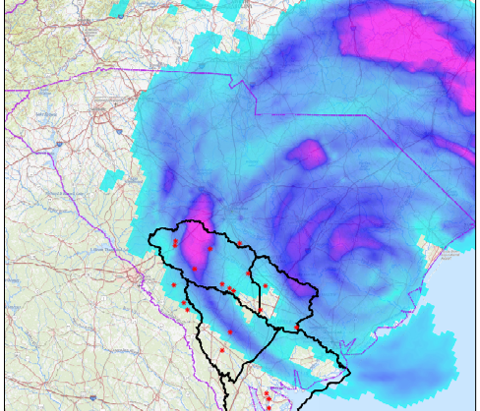
The team has continued to evolve and improve the tool since its inception in 2017, and will continue to do so. One of the next milestones envisioned for the tool is to automate the analysis of not only historical rainfall, but also forecasted rainfall. This will incorporate functionality similar to the tool our stormwater team developed during the Hurricane Florence emergency response. Read more about that here.
Interested?
If you’d like us to evaluate a historic storm event in your area, contact Garrett at garrett.johnston@freese.com.
Krista Melnar, PE, CFM, PMP, is the Stormwater Practice Leader in Austin.